The diversity and volume of Open Data sources has grown rapidly in recent years, partly due to transparency policies adopted by many public institutions. But the data sources are intrinsically difficult to process and combine because they are very heterogeneous.
Open Data sources are often made available in a de-normalized format, e.g., in large CSV (Comma Separated Values) files representing a fixed period of time. Extracting and integrating data from a specific release usually involves manual adjustments to the existing schema, and this needs to be periodically redone for every new data release.
We have been working since 2016 on the extraction of Open Data sources with information about the educational system in Brazil. The extracted information is currently available on a dedicated web portal, called LDE (Laboratório de Dados Educacionais – Educational Data Laboratory). For instance, we had to extract the number of undergraduate teachers from all Brazilian schools for a period of 5 years. While this is a particular indicator, the scenario can be generalized as “periodically extracting indicators from public Open Data sources”. The indicator must be correctly extracted from this source and can be aggregated in different dimensions. However, the data is not provided on a single formatted source, but on a yearly basis, which means the extraction operations needs to be performed periodically. Besides, there are changes on the data definition and format from one period to another.
Based on the experience acquired from this project for the last 4 years, we decided to create a domain-specific approach for managing such evolution, instead of using generic ETL frameworks.
The approach has two central aspects. First, we developed a set of data management operations, covering the data life-cycle. Second, we defined a mapping format that is easy to implement, to share and to maintain.
The five operations are: create table, drop table, update table, remap table and insert data. These operations were enough to cover the open data life cycle of our project, which is shown in the Figure below.
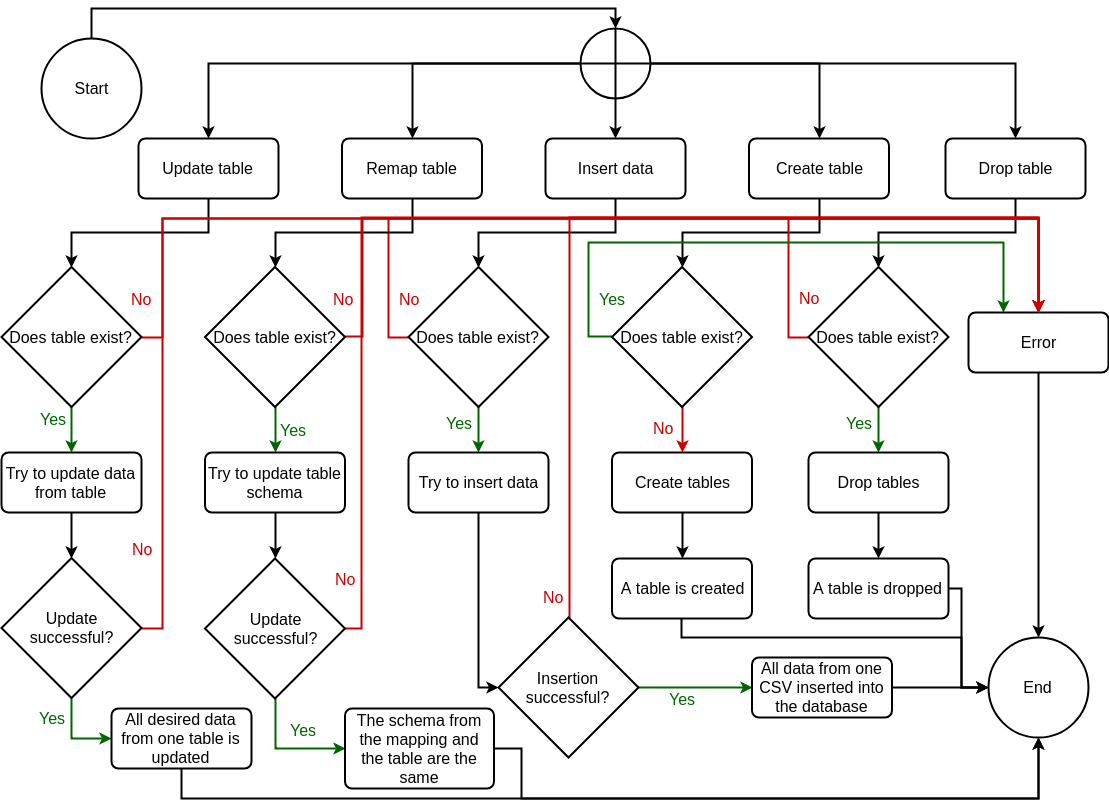
The operations have as input a bi-dimensional mapping. The main columns of the bi-dimensional mappings are:
- the columns of the input Open Data (the CSV files).
- the columns of the target database (we used MonetDb).
- a set of mappings, one per target column and per year. The mappings are written using SQL CASE statements. This format enabled to create bulk inserts, which are fast to execute.
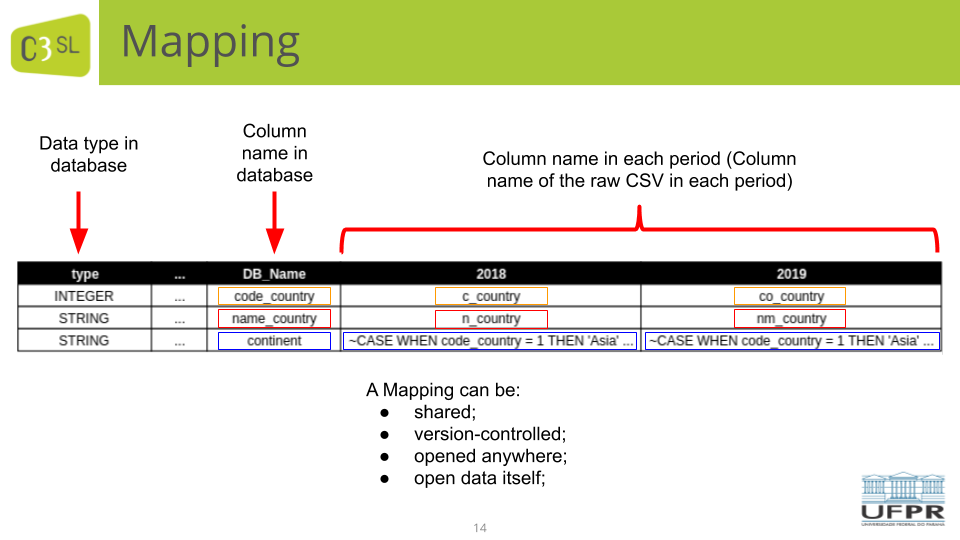
The mappings and operations were very useful to manage all the schema and data evolution during the project. The mappings are CSV files as well, so they can be shared, included in a version control system, they are easy to open and they are relatively straightforward to understand.
We developed a tool called HotMapper (https://github.com/C3SL/hotmapper), in Python, to handle all the open data life-cycle. The mapping CSVs implemented are available at: https://gitlab.c3sl.ufpr.br/tools/mapping-protocols-hotmapper
An article with more details has been published recently: Henrique Varella Ehrenfried, Eduardo Todt, Daniel Weingaertner, Luis Carlos Erpen de Bona, Fabiano Silva, and Marcos Didonet Del Fabro. Managing Open Data Evolution through Bi-dimensional Mappings. IEEE/ACM BDCAT ’19, pp 159-162, December 2–5, 2019, Auckland, New Zealand. Download article.